Why it matters
As a program manager or volunteer coordinator, you have a lot on your plate. And, spending hours sorting through spreadsheets probably ranks pretty low on your list of favorite activities. However, using data to inform your program operations can save you time, save your program money, and even make your job easier.
Most organizations are required to report program evaluation data to their funders, but this only represents a small fraction of the value your data can offer. Unfortunately, a survey of nonprofit professionals found that while the vast majority (90%) collect data, almost half (46%) do not consistently use data to make decisions.
The good news is that you don’t need to be a data scientist to be able to improve your program operations with data-informed insights. With a few basic steps, you can bring this capacity to your organization, transforming an overwhelming spreadsheet into a powerful resource for your team. Follow the steps below to learn how.

Ask the right questions at the right time
The first step is to make sure you are collecting the data you need without overburdening your participants and program staff. While you don’t want to miss anything, you also don’t want to make volunteers fill out a 10 page volunteer application for no reason. A best practice is to start by writing down the questions you want to be able to answer and the data points you’ll need to be able to answer them. Then, you can figure out how you are going to collect that data through program applications, surveys, etc.
Operational vs. program evaluation questions
During this planning phase, consider what information may help you manage your program (operational), not just what your funders require (program evaluation). For example, in addition to counting how many volunteers participate in your program, you can try to understand if you have enough volunteers, or if you need to recruit more.
The answers to operational questions are going to provide you with actionable information that you can use to prioritize your next steps. If you have plenty of volunteers, great! You can focus on engaging and retaining them. If you need more, then you can focus on recruitment efforts. Either way, you know what you need to do to move your program forward.
Examples of operational questions:
- Do we have enough volunteer drivers?
- Is there a bottleneck in our volunteer onboarding process?
- Should we recruit new people, or re-engage inactive volunteers?
- What is our best volunteer recruitment channel?
Data dashboards 101
Now that you know the questions you want to be able to answer, you need to organize the information you collect into a format that is easy to understand and manage. One way to do that is by building a data dashboard.
Dashboards are visual tools that display data in a way that helps monitor and evaluate key metrics. They often display data using big numbers to highlight important values and graphs that show trends. Ideally, a dashboard is focused on a particular topic and will tell a clear story about the data. It will also need to have automation built in so it is efficient to manage (more on this later).
While a dashboard will take some work to set up, it is a powerful tool that can turn unruly spreadsheets into meaningful insights that everyone on your team can use. An operational dashboard will save you time in the long run by making it clear what to focus on in order to have the greatest impact.
Tips to collect and maintain high quality data
To build a dashboard, you will need a solid foundation of high quality data. There are a lot of different aspects to data quality, but following the three best practices below will give you a great start.
Clear, consistent definitions
When you have categorical data, such as volunteer status, the definition of the categories needs to be clear in order to be able to interpret your data. Ideally, the category definitions should be defined and written down so they can be applied consistently across the program.
The table below identifies the steps that must be complete for a volunteer to be assigned a particular onboarding status. Using this table, you can see that the only step between a volunteer being “screened” and “approved” is attending a volunteer orientation. If you have a lot of volunteers stuck in the screening step, this may suggest that the orientation is causing a bottleneck, and you may need to change something about it. Maybe there are not enough orientation sessions scheduled, or maybe the times don’t work for volunteers’ schedules. Whatever the issue is, you are able to quickly find the source of it because you know exactly what it means for a volunteer to be “screened” and can take effective action based on that information.
If you didn’t have volunteer status clearly defined, you wouldn’t be able to tell if the “screened” volunteers are stuck on completing their background check, filling out the waiver, or some other step. This lack of clarity would prevent you from being able to diagnose the problem and act efficiently to resolve it.
Standardization & structured data
In general, data that is collected using multiple choice questions will be much easier to analyze and include in a dashboard than open text boxes. A good way to decide what format to use for a question is to consider if it would be helpful to be able to aggregate or filter your data using that question. If so, the question should be multiple choice.
For example, if you ask volunteers to list their skills on your volunteer application, an open text box will result in variations of the same answer (e.g. computer skills, tech, technology, etc.), while a multiple choice question will force consistency. Consistent answers will make it much easier to use simple Excel/Google Sheets formulas or filters to count how many tech volunteers you have or to filter your list to see only tech volunteers, for example. When you have only a few volunteers, this may not seem necessary, but as your program grows it will be!
One data type per column
As you collect data, it’s important to store it in a way that makes it easy to analyze later. Especially if you are managing your program using spreadsheets, you’ll want to make sure that each column (or each field, if you’re using a database) has only one type of information. Structuring your data this way will make it much easier to keep organized and use Excel/Google Sheets formulas and filters.
Simple tools to automate your dashboard
One key element of a dashboard is automation using functions or formulas. Formulas reference data by location in a table (e.g. cell A2) rather than specific numbers, so the results change automatically when the data is updated. This means that once your dashboard is built, you should not need to do anything besides refresh the data.
There are many software tools you can use to build a data dashboard, but you don’t necessarily need to use anything fancy. It’s possible to make a simple dashboard in Google Sheets, which is free.
Google Sheets dashboard tutorial
If you’re a Mon Ami customer already, you don’t need to worry about the technical aspects of building a dashboard (we will build it with you!). Request a consultation now.
How to interpret and act on the results
So you’ve built a dashboard based on thoughtful questions, high quality data, and time-saving automations. Now what? Interpreting the results will require understanding the numbers in the context of your program and goals. The examples below illustrate the process and some considerations you may need to make to understand your dashboard.
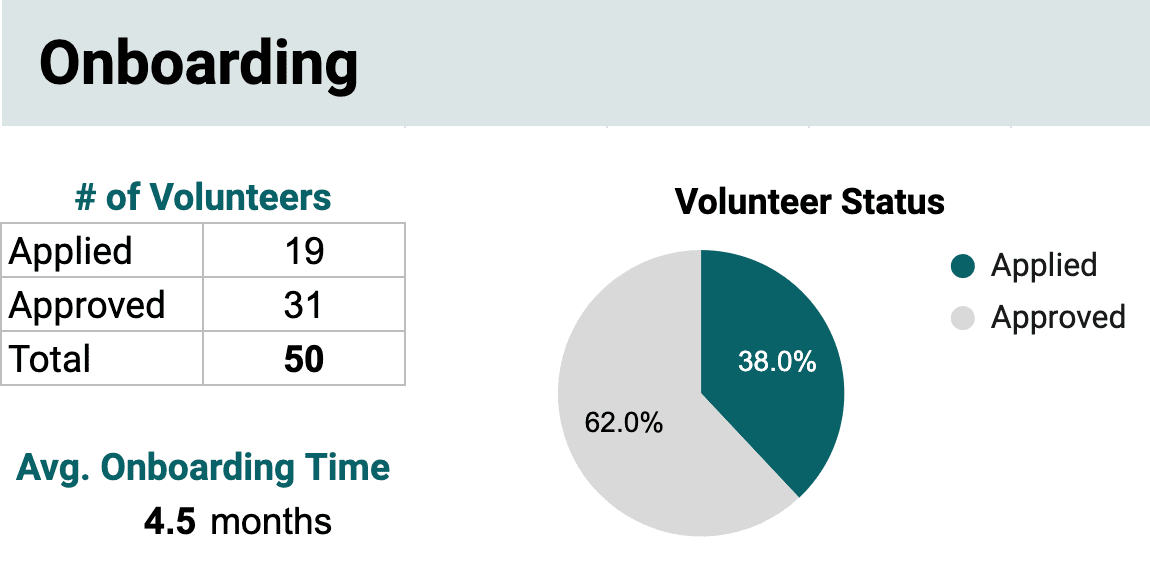
Example: You notice there seem to be a lot of volunteers with a status of “applied” and the average onboarding time is longer than you would expect.
Interpretation: You could be getting more volunteer applications than you can efficiently handle.
- Take Action: If you have any online recruitment ads, such as a VolunteerMatch post, you may want to temporarily remove it so you can focus on completing the onboarding steps with those that have already applied.
Other interpretation: Your onboarding process may have inefficiencies or other issues that are slowing down the process
- Take Action: Look at your onboarding process end to end to consider where there may be inefficiencies. For example, do volunteers need to sign paper forms? Maybe you could look into an e-signature solution to speed up that process.
- Take Action: Have you found that you are losing applicants at a certain step? Maybe there is a problem with that step, or maybe that requirement should be stated more clearly up front so you don’t waste time with volunteers that won’t qualify.
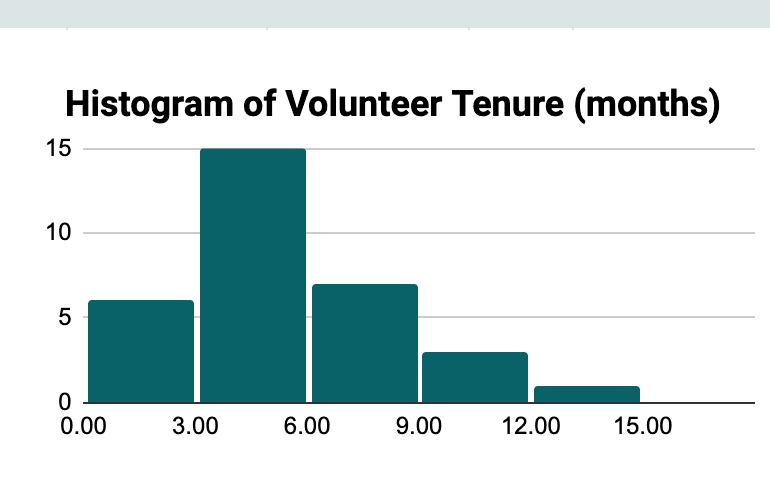
Example: You notice that most volunteers drop out of the program after about 6 months. There are also a significant number of approved volunteers that haven’t completed any activities.
Interpretation: You may have too many volunteers and not enough for them to do.
- Take Action: Slow down volunteer recruitment and focus on client recruitment. If volunteers are being onboarded and then are given nothing to do, they are not going to stick around very long.
- Take Action: Spend some time reaching out to inactive volunteers to try to re-engage them. You could create a simple survey asking a couple of questions about why they are not participating (Did they move? Are they having trouble signing up for activities? Are there no activities that interest them?). With that information, you can decide how to address any common issues.
Conclusion
As a volunteer coordinator or program manager, you can use well organized data to support your program operations. You’ll save time and money while making operational decisions easier, which means more time to build relationships with program participants, more money to grow your program, and less stress about how to prioritize your to-do list. You can start small by building a basic dashboard using free software, then learn and grow from there.